Saturday, March 27, 2010

Module 10- Isopleth Map


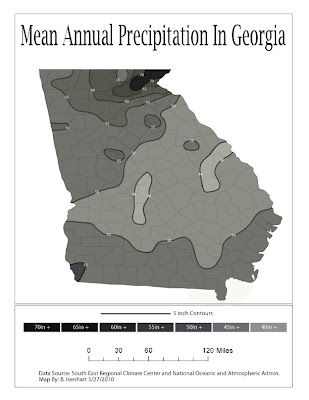
This is a Isopleth Map of the Mean Annual Precipitation in the state of Georgia. I really liked this lab, it was not real difficult and pretty much straight forward. I used the live paint tool in AI to fill in the different areas, then used the pencil tool with a white background to cut the edges around the state.
Friday, March 19, 2010

Module 9- Flow Map


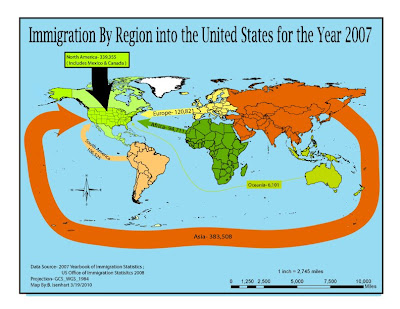
This is a map of the Immigration of People from regions around the world into the United States in the year 2007. I thought I was beginning to get the hang of AI, but after the break we had I think I may have forgotten a little bit about it. I mostly just had problems with the layers, theres so many different trees in some of the maps I get lost trying to find the particular layer I'm trying to modify or make it be the top-most layer.

Sunday, March 7, 2010

Module 8: Dot Map

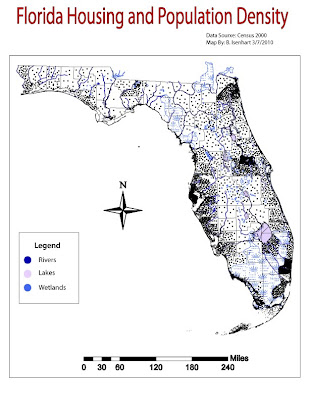
This is a Dot map of the housing and population density of Florida in 2000. This was a very time consuming lab and I'm very happy to be finished with it. It wasn't a hard lab to complete, but making all the dots really kind of slowed it down. I think it turned out well, I didnt really have any issues with doing anything. I'm really having fun learning how to do these maps in both classes.

Tuesday, March 2, 2010

Module 7: Proportional Symbol Maps

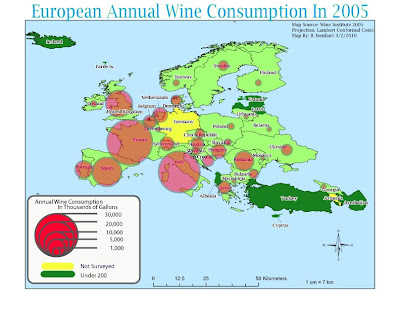
This map is a Proportional Symbols Map showing the Annual Wine Consumption on Europe in 2005. This lab was a little time consuming at first, but after getting the formuals down and entered into Excel things went pretty fast. Making the symbols didn't take as long as I thought it would but other than not being sure how to start off, this lab eneded up being pretty fun and simple. I feel like my map is well balanced and I also tried to pick colors that would show up well with eachother such as the man land areas underneath the red circles.